


Bitcoin has recently been under significant selling pressure, with prices sliding below $80,000 – levels not seen since late 2025. The world’s largest cryptocurrency continues to weakly trade as risk-off sentiment grips markets and macroeconomic forces pressure crypto prices. According to recent reports, BTC fell over 6–8% in the last 24 hours, with spot prices dipping as low as around $78,700 amid broader market weakness.
Further fueling the decline, financial markets are currently showing reduced liquidity, institutional outflows, and geopolitical concerns that have triggered flight from risky assets like Bitcoin into safer alternatives such as gold.
📉 Current Price Snapshot (Live)
As per the most recent aggregated price data (today):
-
Bitcoin (BTC/USD): ~ $78,700 – $82,400 range
-
24h Change: Down ~5–7%
-
Weekly Trend: Sharply negative
-
Market Cap: ~ $2.6–$3.0T (crypto market overall down)
This reflects a continuation of a bearish phase, with BTC sliding from multi-month highs and breaking below key chart supports.
🟠 Why Bitcoin Is Falling – Real Current Drivers
1️⃣ Macro & Fed Leadership Shakeup
Recent developments in U.S. Federal Reserve leadership and monetary policy expectations are tightening liquidity, adversely affecting risk assets like Bitcoin. Traders fear higher interest rates and tighter financial conditions, reducing speculative inflows into crypto.
2️⃣ ETF Outflows & Institutional Selling
Record outflows from Bitcoin ETFs (nearly $1.5B in recent weeks) have removed major buying demand that previously supported BTC. Without strong ETF inflows, price pressure increases.
3️⃣ Correlation With Risk Assets
Bitcoin currently acts like a risk asset, moving in sync with tech stocks and equities — when markets sell off broadly, BTC follows as capital rotates to safety.
4️⃣ Whale Distribution
Analysis shows large holders (“whales”) relocating BTC to exchanges for profit-taking, increasing supply and downward pressure.
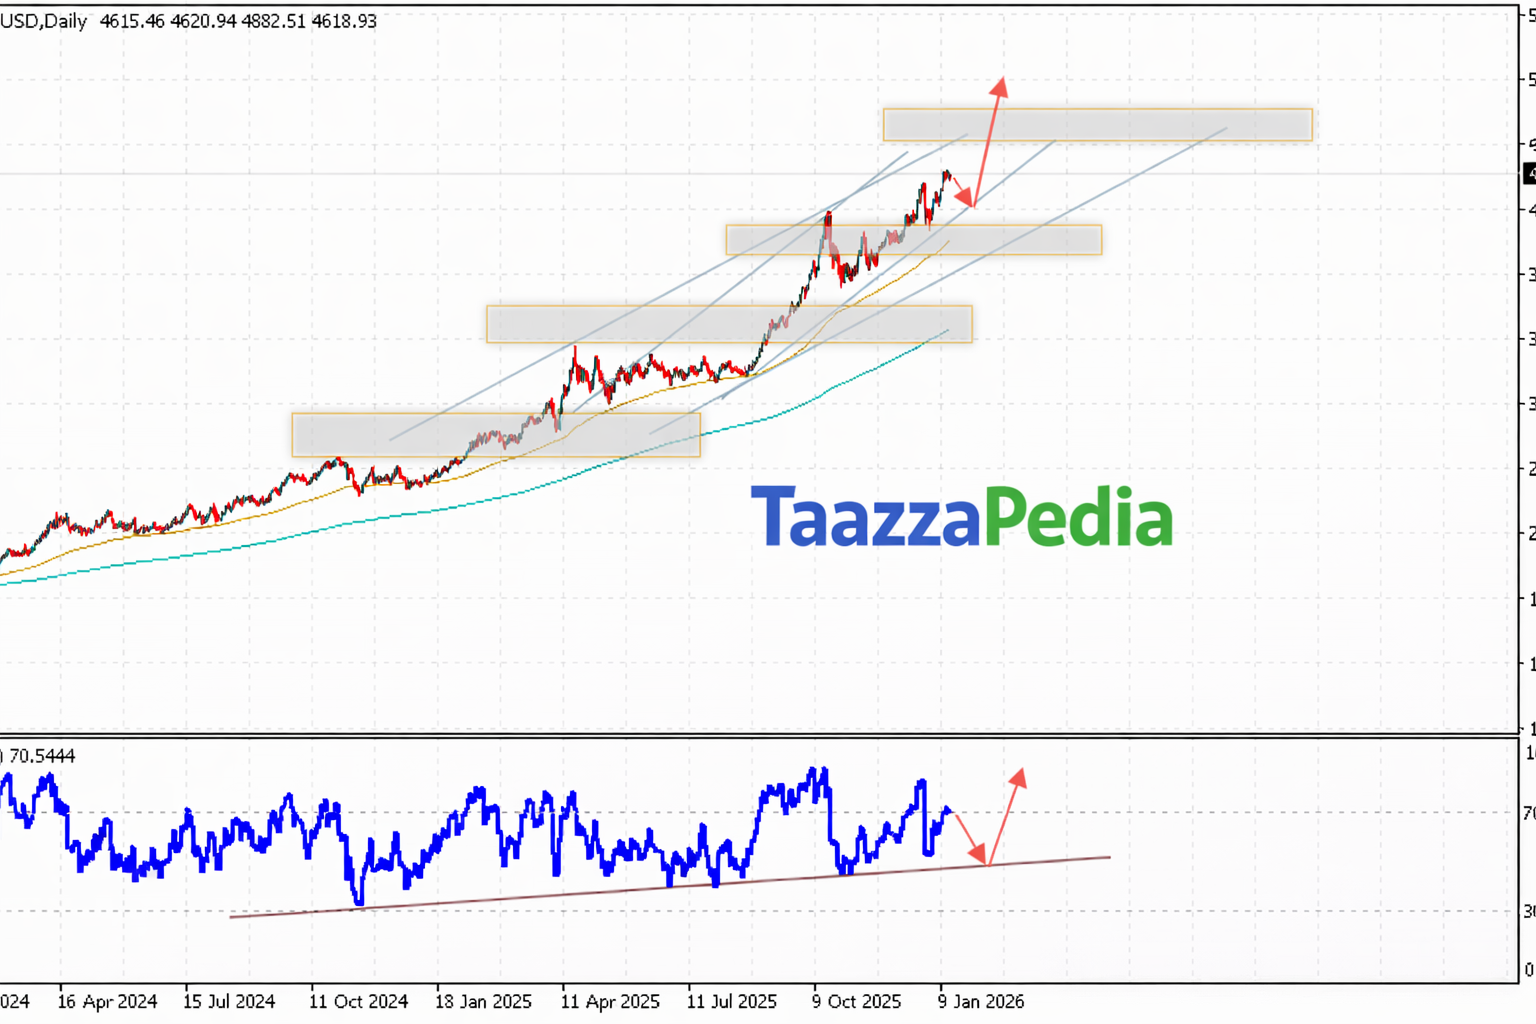
5️⃣ Technical Breakdown
BTC recently broke below major support near $85,000, triggering stop-loss levels and accelerating selling momentum.
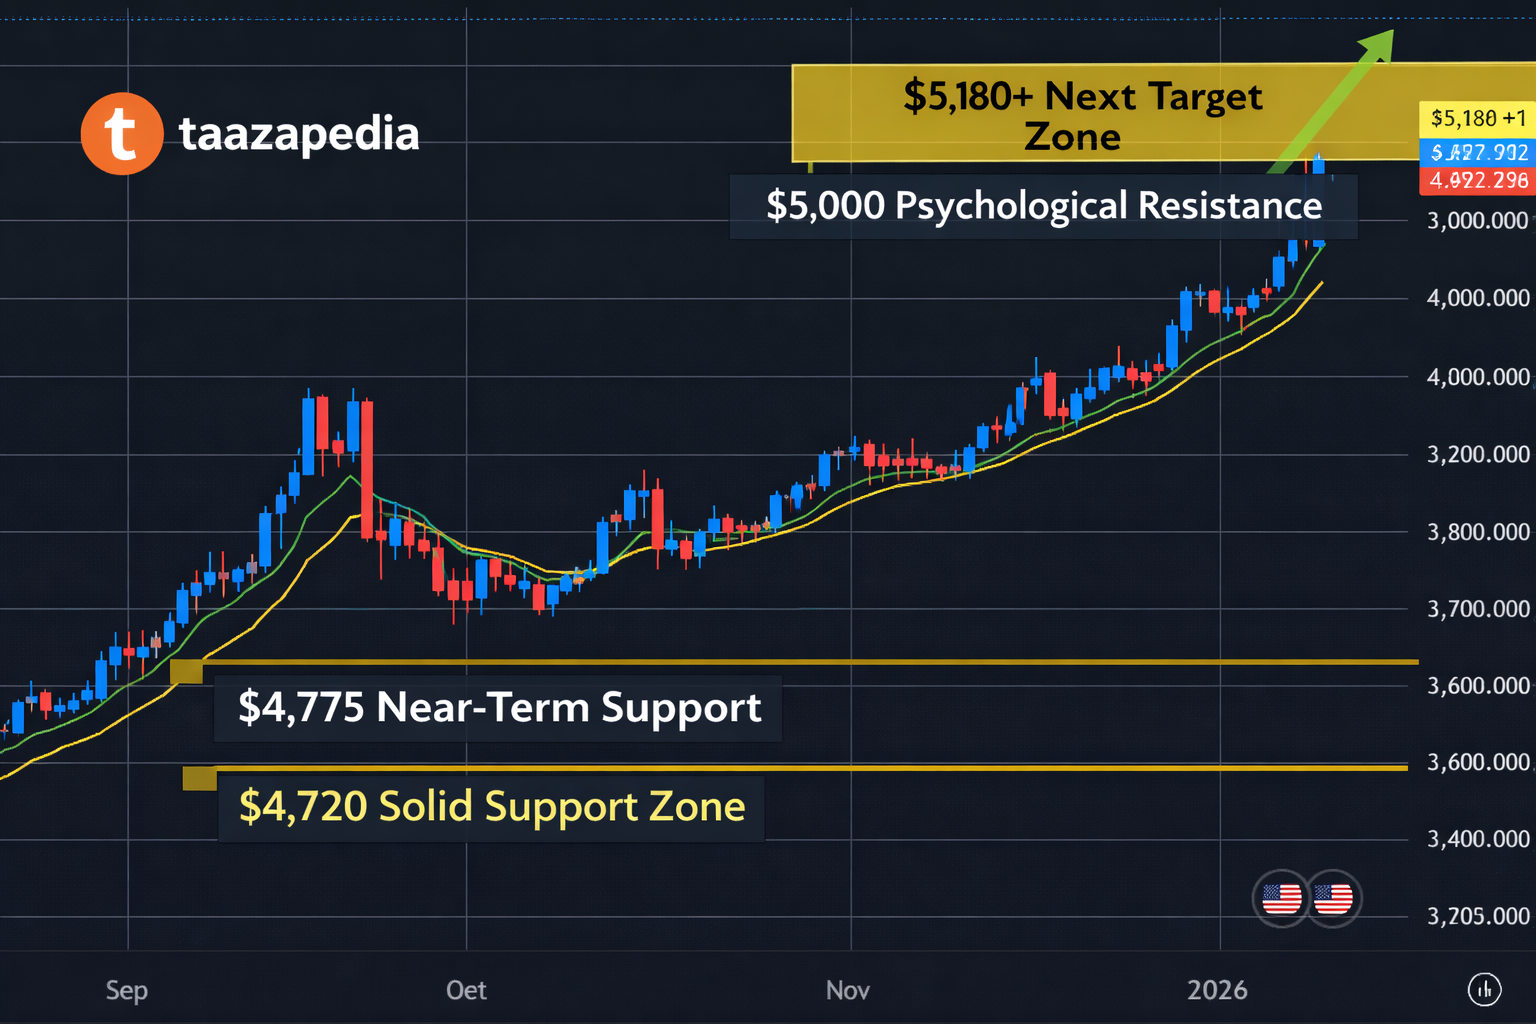
📊 Current Support & Resistance Levels
Here are the trade-relevant levels BTC traders should watch:
🟥 Resistance Levels (Upside Barriers)
-
$82,500 – Short-term resistance
-
$88,000 – Psychological resistance
-
$92,000 – Next major ceiling
-
$100,000 – Major psychological milestone
🟩 Support Levels (Key Floors)
-
$78,000 – Immediate support
-
$74,500 – Strong demand zone
-
$70,000 – Major historical support
-
$65,000 – Cycle low support if weakness deepens
💡 Weekly & Short-Term Market Outlook
Bullish Scenario (Less Likely, but Possible):
If BTC can hold $78,000–$80,000 support and attract renewed buying (especially from institutional traders), we may see a relief bounce targeting:
-
Short-term rebound → $82,000–$88,000
-
Break above → $92,000+
Neutral / Range Trading Scenario:
Bitcoin may consolidate sideways between $74,000–$88,000 as markets await macro catalysts like Fed announcements or crypto adoption news.
Bearish Scenario (Current Bias):
If price decisively closes below $74,000, deeper correction toward $70,000–$65,000 becomes likely, especially as liquidity remains constrained and risk assets struggle.
🧠 Trader Strategy Note
✔️ Buy-on-dips near strong support zones
✔️ Use tight stop losses due to volatility
✔️ Watch ETF flows and macro news for major catalysts
✔️ Day traders may find entries at weekly support levels before rebounds
📌 Conclusion — BTC Today
Bitcoin remains in short-term bearish territory as macro pressures intensify and risk assets sell off. While medium-term fundamentals like adoption and long-term institutional interest remain positive, near-term price weakness is driven by liquidity tightening, ETF outflows, and technical breakdowns.
For traders, support near $78,000–$74,000 is critical — holding it may lead to consolidation or small bounces, but failure may signal deeper corrective moves.
Stay tuned to Taazapedia for continuous updates on Bitcoin price action, support & resistance levels, and trading insights! 🚀