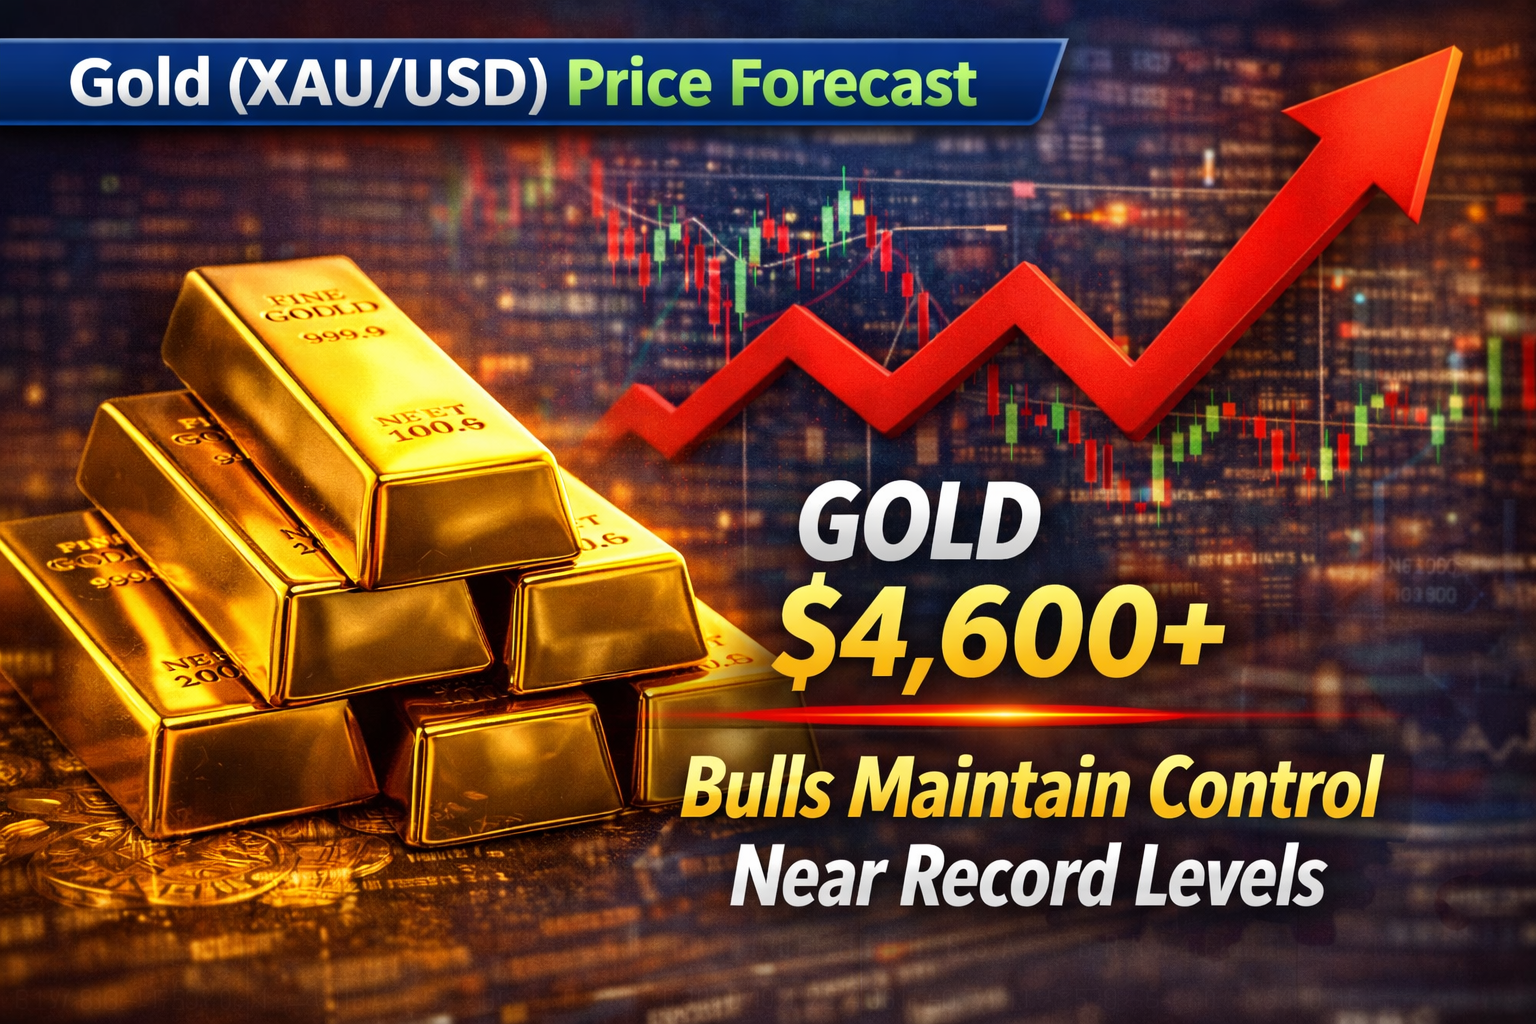


Gold prices have experienced a sharp downward correction after peaking near record highs, reversing a multi-month rally that had pushed XAU/USD above $5,400–$5,500/oz. This pullback has been driven by intense profit-taking, rising real yields, a stronger U.S. dollar, and a forced liquidation event that wiped out trillions in market value.
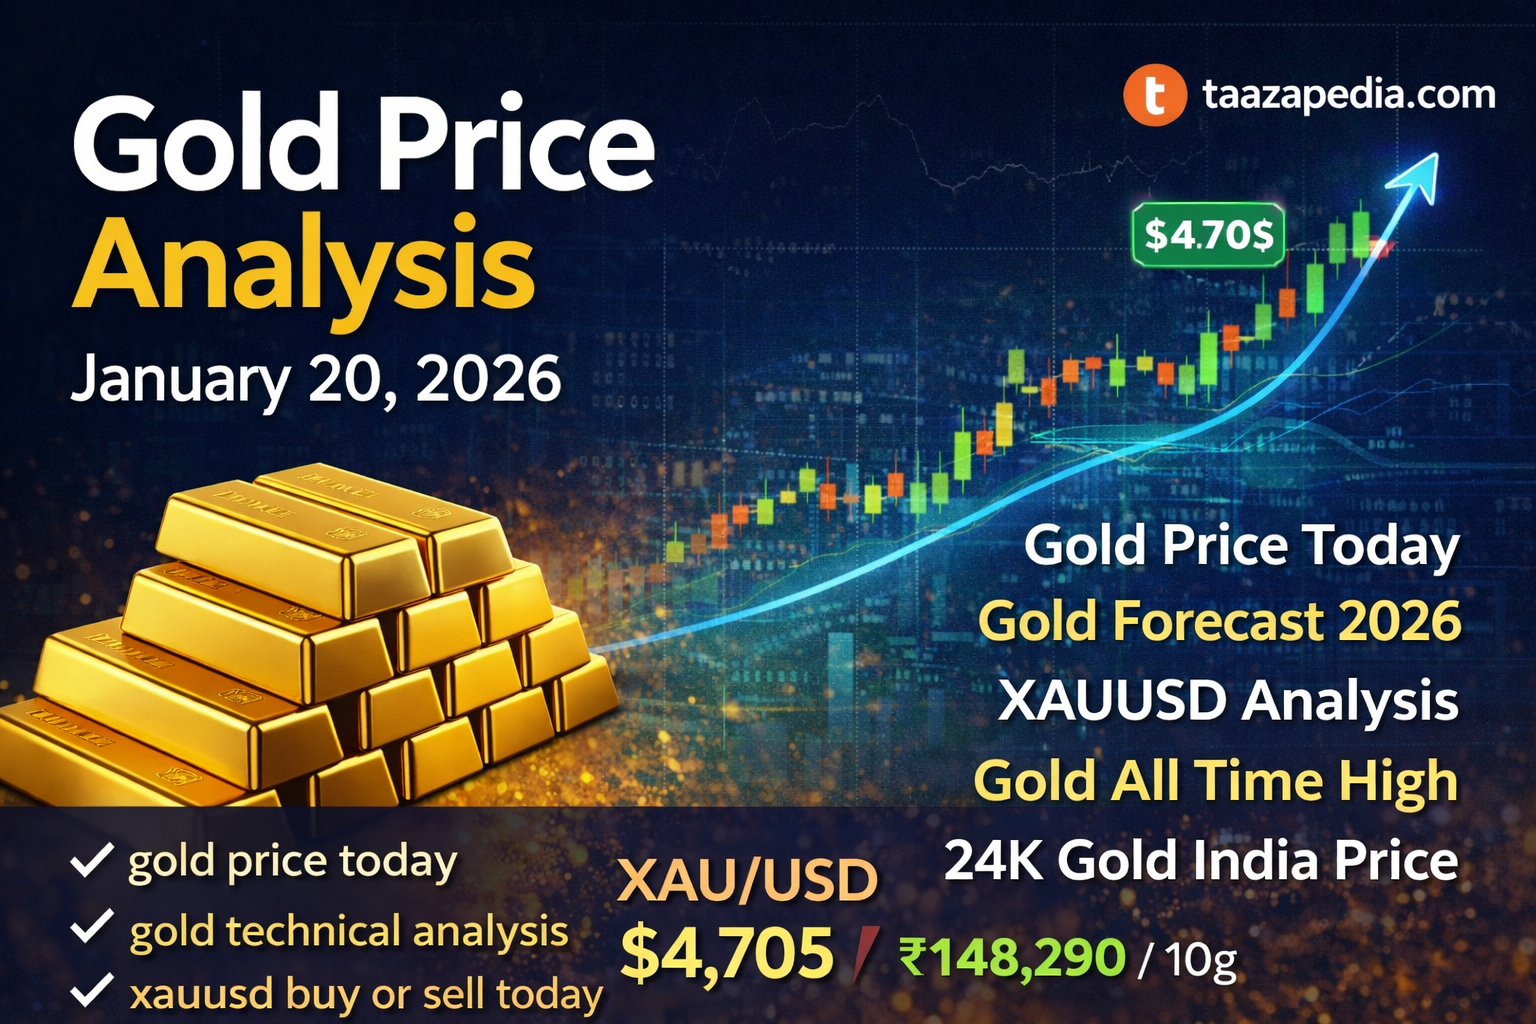
On Friday (30 Jan 2026), gold plunged around 8–12% intraday, exploring levels near $4,700–$4,750 per ounce before price stabilized. Both gold and silver suffered significant sell-offs, especially after momentum shifts tied to global macro conditions and liquidity stress.
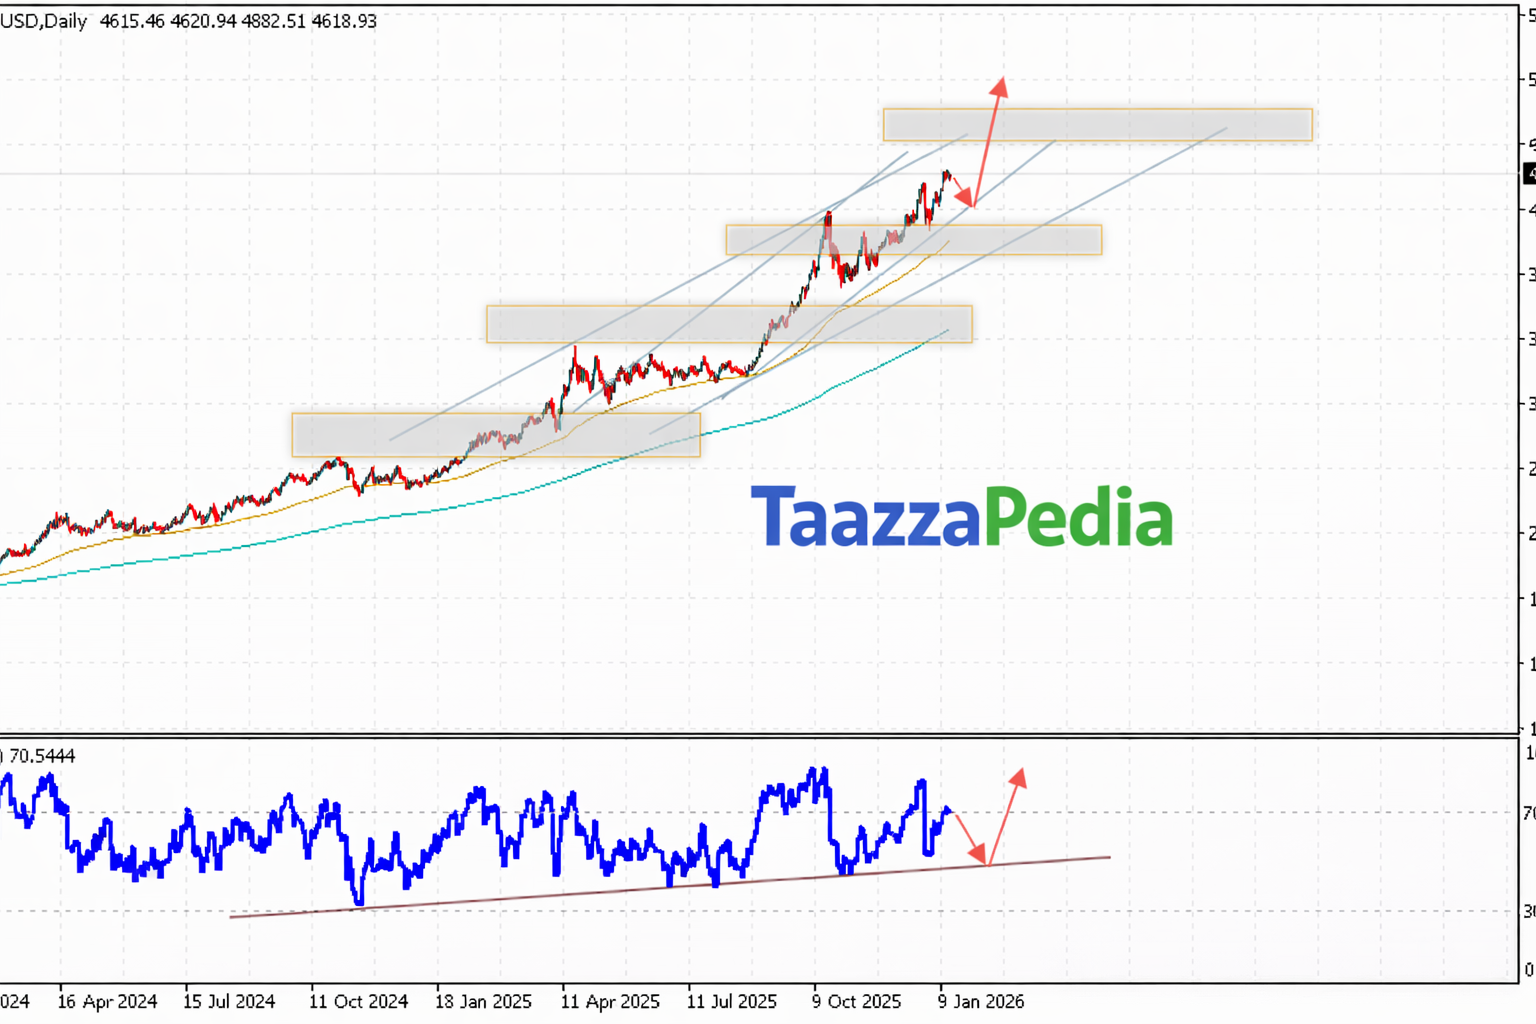
Technical indicators also show the development of a medium-term blow-off top, signaling that the extended rally may have exhausted short-term buying pressure and set the stage for deeper corrections.
📍 Current Gold Price Snapshot
As of the latest real-time market reflections, spot gold (XAU/USD) is trading below recent highs and testing key support levels after the crash. Central banks continue accumulating gold, but short-term volatility remains elevated. (Based on aggregated market data)
🔍 Why Gold Is Falling Now (Current Drivers)
📉 Intense Profit-Taking After Historic Rally
Gold had rallied to unprecedented levels fueled by safe-haven buying, but extended positioning led to strong liquidation once risk sentiment briefly improved.
📈 Real Yields & Strong Dollar Pressure
Rising real yields and a bounce in the U.S. dollar have pressured non-yielding assets like gold, further contributing to the downtrend.
📉 ETF & Futures Selling
Precious metal ETFs and futures positions have experienced outflows, adding to the selling pressure.
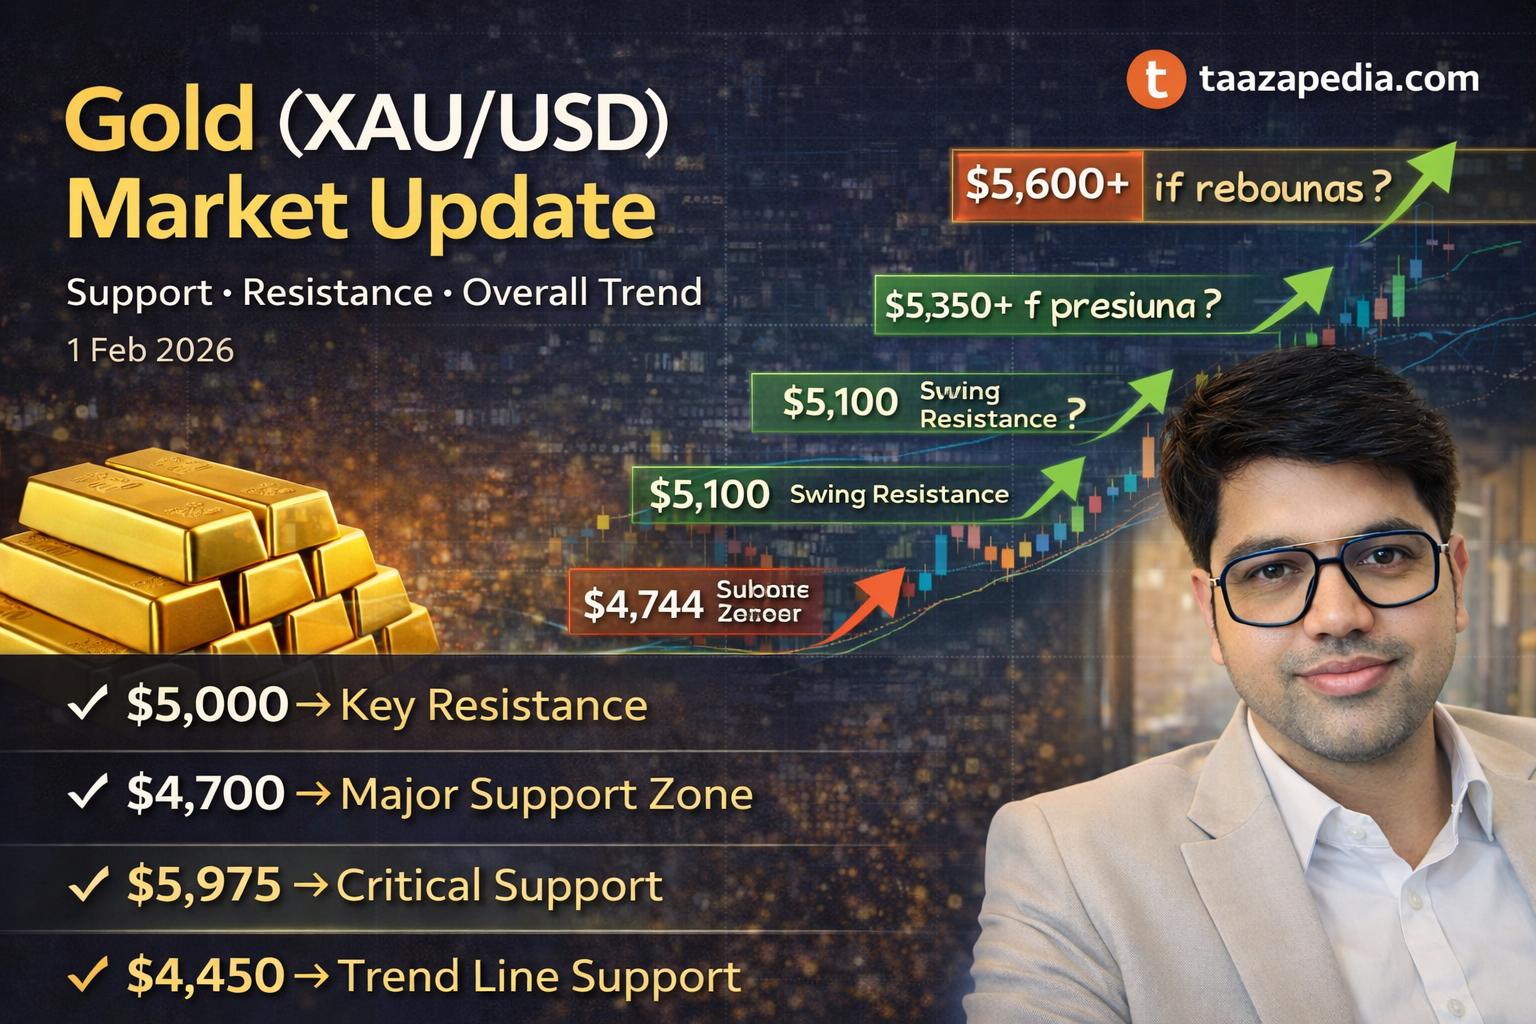
📊 Technical Outlook – Support & Resistance Levels
Here are the most critical price levels traders should watch this week:
🟢 Resistance Levels (Upside Targets)
-
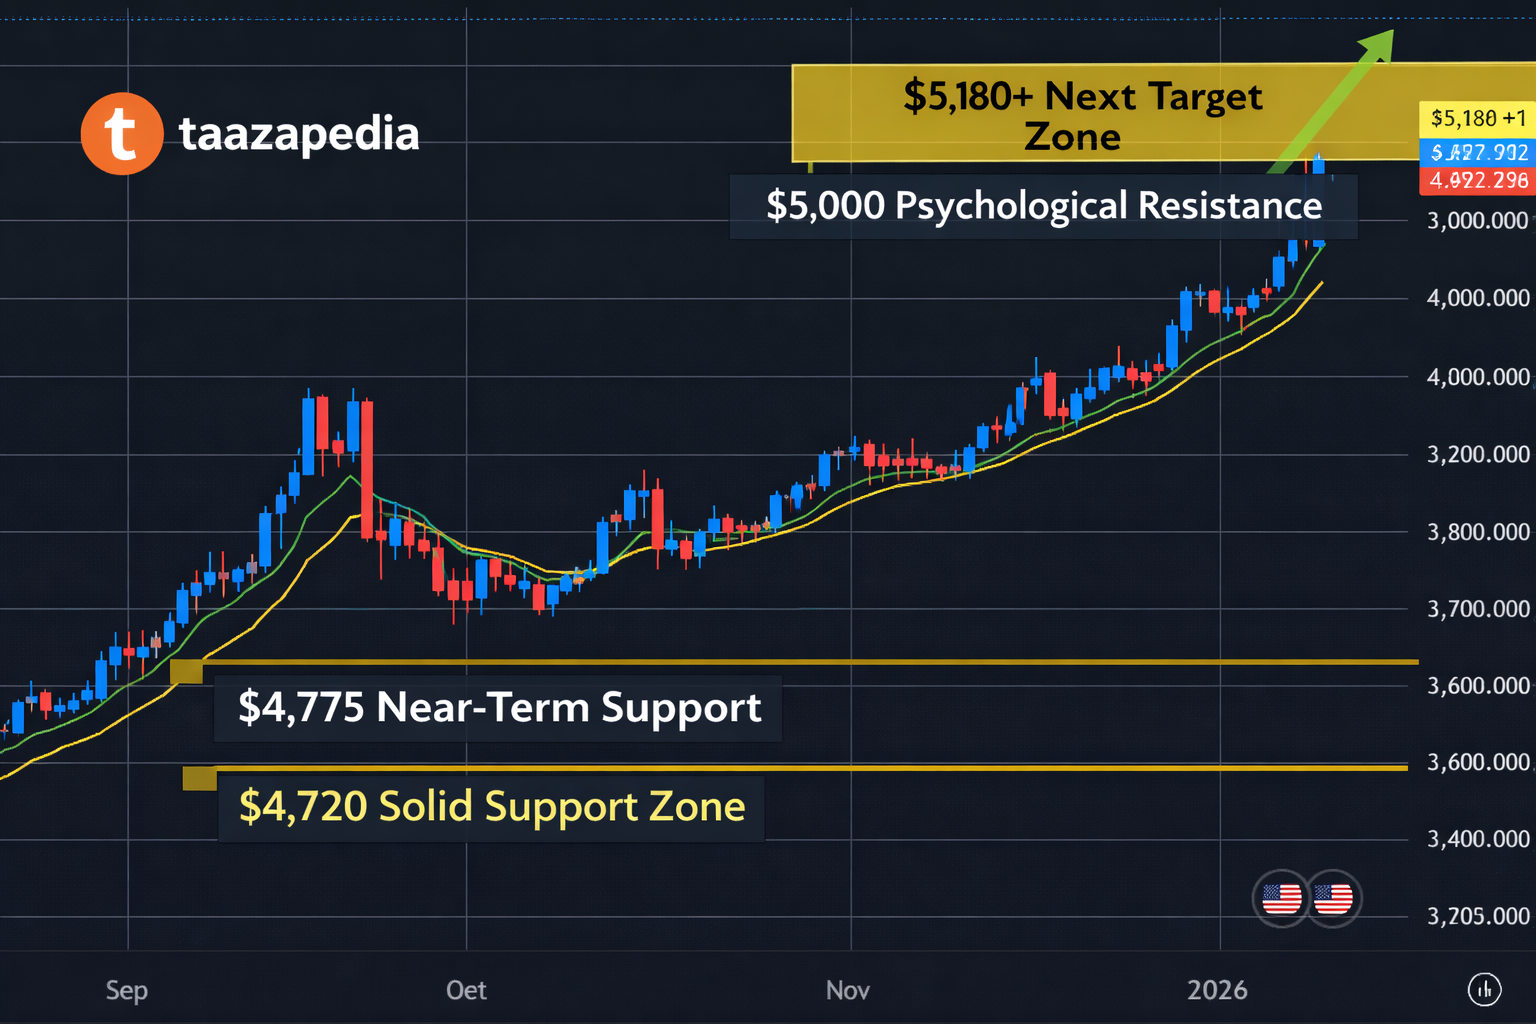
$5,000 – Psychological Barrier → Key overhead resistance (first line of defense)
-
$5,100 – Secondary Resistance → Prior swing zone
-
$5,350 – Major Supply Zone → Tough barrier for renewed upside
-
$5,600+ – Longer-term Target if Momentum Returns
🔵 Support Levels (Key Floors)
-
$4,800 – Immediate Support → Short-term bounce zone
-
$4,700 – Major Support Zone → Strong demand seen near this level
-
$4,600 – Critical Structural Support → Break here opens deeper correction
-
$4,450 – Trend Line Support → Important for medium-term trend continuity
🔎 Technical studies reflect that as long as gold manages to hold above $4,700–$4,800, the medium-term bullish bias can remain intact despite the corrective move.
📆 Weekly & Short-Term Forecast
📈 Bullish Scenario
If gold finds support and rebounds off $4,700–$4,800, buyers may step in again. A sustained move above $5,000 puts $5,100 – $5,350 back into focus. Long positions above $4,800 with tight stops can be considered by breakout traders monitoring risk sentiment.
⚠️ Neutral / Sideways Scenario
Expect a possible consolidation between $4,700 – $5,000 as the market digests the recent crash. This range will likely define the next directional bias.
📉 Bearish / Correction Scenario
A decisive breakdown below $4,700 → $4,600 could extend the correction deeper toward $4,500 – $4,300. This would reflect a shift to a more cautious outlook, possibly influenced by stronger USD or hawkish Fed positioning.
🧠 Analyst & Institutional Forecast — Extended View
Major institutions like UBS, Goldman Sachs, Deutsche Bank and Bank of America continue to maintain bullish medium-to-long term forecasts for gold despite volatility — projecting gold prices in the $5,000–$6,200+ range by later in 2026 based on central bank demand, investment flows and macro diversification trends.
However, short-term data suggests that the trend may be shifting from blow-off top momentum to consolidation and corrective phases — typical after extended rallies.
📌 Market Strategy for Traders — Quickly Summarized
✴️ If Hold Above Support:
-
Buy dips near $4,700 – $4,800
-
Target: $5,000 → $5,100
✴️ If Break Below Critical Support:
-
Short continuation toward $4,600 → $4,500
✴️ Risk Management:
-
Keep trail stops tight due to high volatility
-
Use multiple time-frame confirmation before entries
📍 Conclusion — Gold Today
Gold is currently in a corrective pullback after one of its strongest rallies in history, but long-term fundamentals remain supportive of higher prices. If key support levels hold, buyers may return and test resistance zones again. Conversely, if key supports break, deeper correction is likely before gold finds renewed strength.
Stay tuned to Taazapedia for updated gold price action, live support & resistance levels, and trading setups as the precious metals market continues to evolve.